Is it time to act now?
We’ve reached the point where global warming is undeniable. Already, 2020 is set to be the hottest year on record. This is a worrying trend, especially since the past five years have been, statistically, the five hottest years ever.
Luckily, more people than ever are noticing this – a 2019 Ipsos MORI poll showed that 85% of Britons are very concerned about climate change, up from 60% in 2010. The rise of groups like Extinction Rebellion show that many people are passionate about taking action to limit humanity’s impact on the environment.
Put simply, it’s time to act before it’s too late. One of the easiest ways to help the planet is by making an effort to limit the amount of CO2 we produce – also known as reducing our carbon footprint. But how does the way we consume wine play into this?
Packaging is recyclable, fuel is not

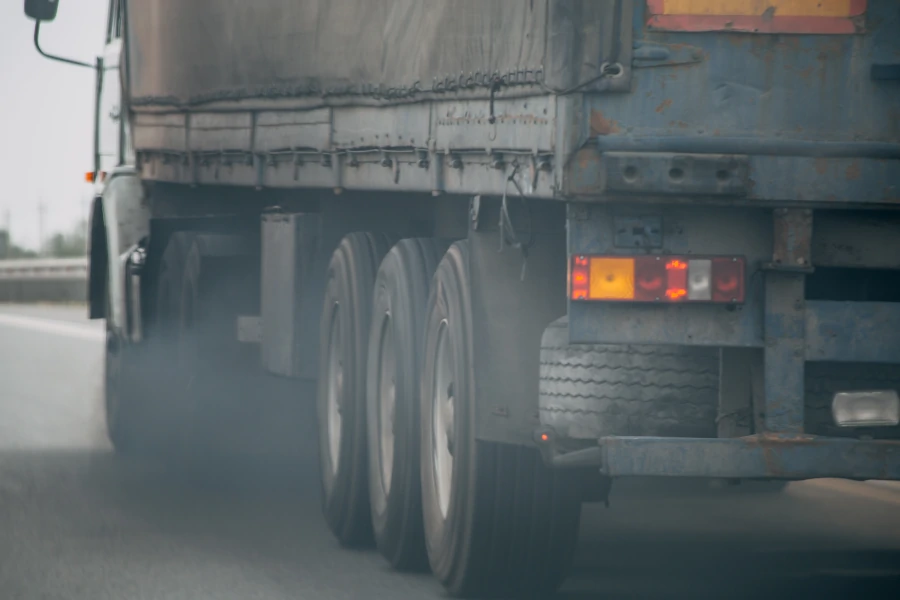
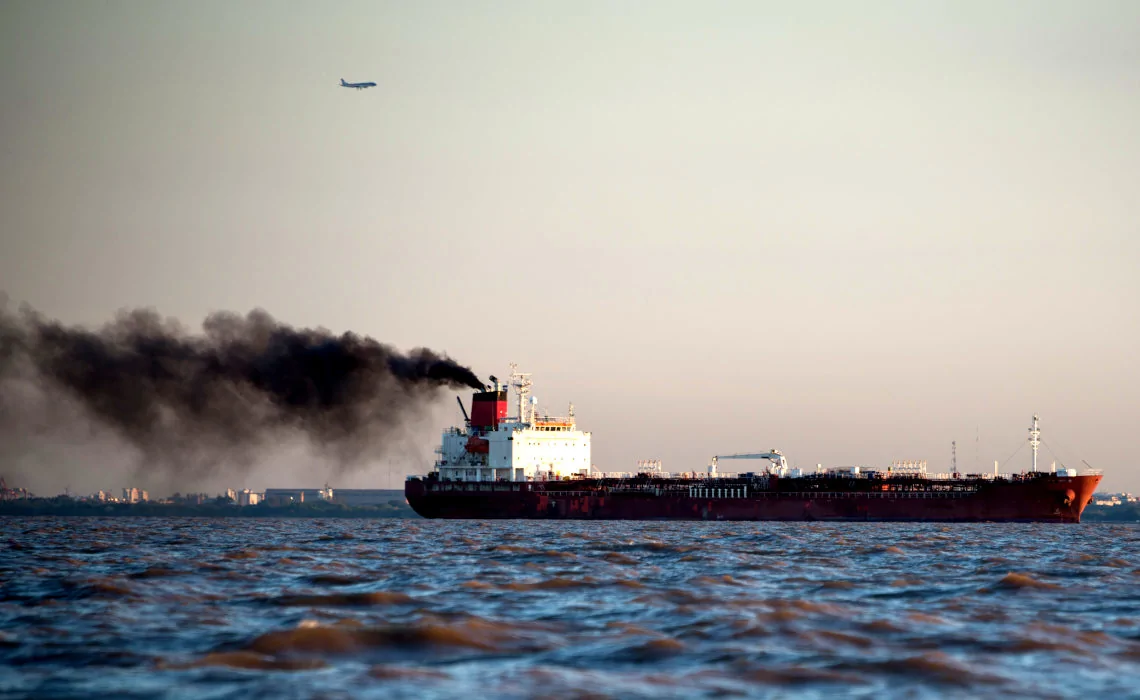
In terms of reducing our environmental impact, we’re making pretty good headway. The UK already recycles over 70% of its packaging waste (UK Government, 2017), putting the country way ahead of EU targets. It’s something to feel good about. But while packaging from food can be recycled, the fuel used to transport it to your table can’t. Transport is a major source of CO2 – boats, planes and lorries are responsible for 20% of all greenhouse gas emissions in Europe.
While some types of farming produce CO2, studies show that winemaking is actually carbon neutral. While some some CO2 is released in the process, vines consume CO2 as they grow. But the real problem comes from the transport pollution, which fully depends on how far the wine has to travel before it reaches your glass.
How much CO2 is generated by importing our wines?

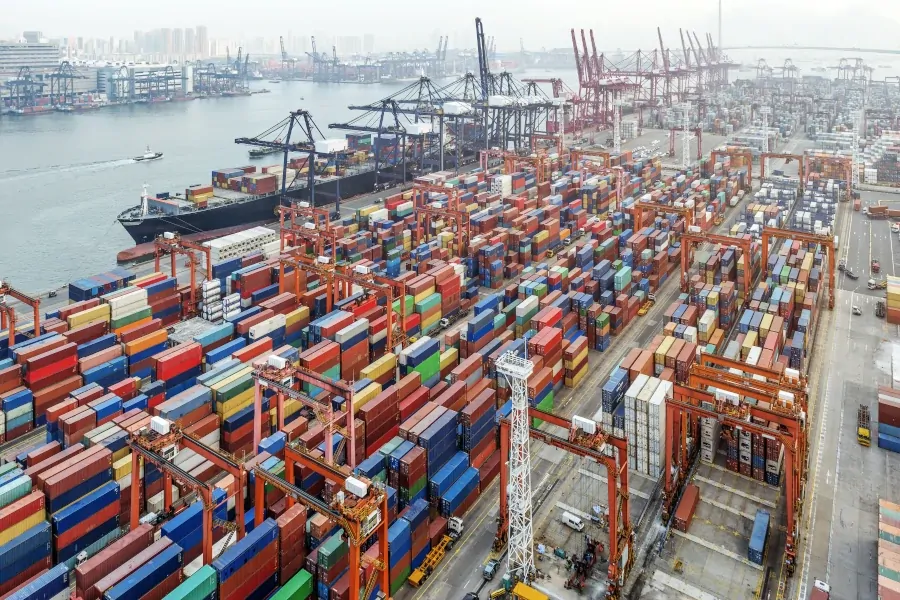
Container ships and lorries that carry wine from New Zealand to Britain have to make an astonishing journey of 17 thousand miles, across three oceans. Unsurprisingly this is quite a fuel-intensive route, and produces 2 kg of CO2 per 6-bottle case of wine (calculated using ECTA Guidelines [2]). For wine that comes from Argentina, each case is responsible for 1.6 kg of CO2 emissions, and Australia is at 1.8 kg per case.
It doesn’t sound like a lot, does it? Well, things get a bit more grim when you start adding it up. Over the course of a year, the UK imports a whopping 220 million litres of wine from Australia alone [3], generating 87 thousand tonnes of CO2. This is roughly as much as heating 30 thousand UK homes for a year [6]. Importing wines from New Zealand, like the ever-popular Marlborough Sauvignon Blanc, adds an extra 19 thousand tonnes of CO2 to that total. And that’s before we even mention South Africa, Chile and the USA!
Choosing wines from Europe is more sustainable
Although the UK imports three times as much wine from France and Italy than it does from New Zealand, shipping wine from the Southern Hemisphere still generates far more CO2 than buying from countries closer to home. For example, shipping a 6-bottle case of wine from Italy or France generates three to four times less CO2 than from the New World.
Table 1. CO2 Emissions per Import Route
| UK Import Route | Argentina | New Zealand | Australia | Italy | France |
|---|---|---|---|---|---|
| Pallet Weight, tonnes | 0.85 | 0.85 | 0.85 | 0.85 | 0.85 |
| Est. lorry route winery to port, km | 1058 | 118 | 203 | 1,237 | 1037 |
| CO2 Lorry route per tonne-km, g | 62 | 62 | 62 | 62 | 62 |
| CO2 Emissions, Lorry route per pallet, g | 55,757 | 6,219 | 10,698 | 65,190 | 54,650 |
| Distance, Container Ship, km | 14,242 | 26,921 | 23,309 | 0 | 0 |
| CO2 Ship / tonne-km, g | 8.4 | 8.4 | 8.4 | 8.4 | 8.4 |
| CO2, sea travel per pallet, g | 101,687 | 192,216 | 166,428 | 0 | 0 |
| Total CO2 per pallet, g | 157444 | 198,435 | 177,126 | 65,190 | 54,650 |
| Total CO2 per bottle, g | 262 | 331 | 295 | 109 | 91 |
How UK wine lovers can do their bit for global warming
It’s pretty simple – buy wine produced as close to home as possible. This doesn’t mean exclusively buying wine from Kent, of course. France, Italy and Spain are right on our doorstep and make fantastic quality wines. As well as classic favourites like Grand Cru Bordeaux, Barolo DOCG and Reserva Rioja, there are lots of small and innovative producers creating exciting new twists on classic styles.
So when the local supermarket entices you with an attractive deal on Australian Cabernet Sauvignon, it’s worth remembering that shipping that bottle from Australia causes three times more harm to the planet than the bottle of Italian Chianti sitting on the shelf next to it.
Table 2. UK Wine Imports CO2 Pollution
(Based on 2015 and 2016 data, sources: Decanter, The Drinks Business)
| UK Import Route | Argentina | New Zealand | Australia | Italy | France |
|---|---|---|---|---|---|
| Litres | 20,000,000 | 42,000,000 | 220,500,000 | 132,300,000 | 135,000,000 |
| Pallets of wine | 44,444 | 93,333 | 490,000 | 294,000 | 300,000 |
| CO2 per pallet, g | 157,444 | 198,435 | 177,126 | 65,190 | 54,650 |
| Tonnes of CO2 pollution | 6,997 | 18,521 | 86,792 | 19,166 | 16,395 |
Choosing wine with fewer air miles – the next step to reducing your carbon footprint
Happily, more and more people are doing their bit to protect our planet by reducing their food miles, switching to produce sourced from local farmers instead of more exotic options that have travelled halfway around the world. The next step towards taking responsibility for the environment is sourcing wine from our neighbouring countries. Why not try the new “Gran Selezione” class from Chianti Classico DOCG or a delicious white like Gewürztraminer from Alpine vineyards in Italy’s Alto Adige DOC?
If you’re used to drinking New World wines, and are wondering how to choose a nice bottle from Europe that fits your taste and budget, we’ve created a number of simple and friendly guides. We recommend starting with “The Ultimate Guide to the best Italian Wine”.
Sources:
[1] UK Statistics on Waste, Department for Environmental Food & Rural Affairs, UK Government, 2017
[2] Guidelines for Measuring and Managing CO2 Emission from Freight Transport Operations, European Chemical Transport Association.
[3] https://www.decanter.com/wine-news/uk-wine-imports-top-countries-384745/
[4] https://www.thedrinksbusiness.com/2017/01/argentina-tops-uk-chart-for-growth-in-2016/
[5] http://ports.com/sea-route/port-of-auckland,new-zealand/london-thamesport,united-kingdom/
[6] UK Households’ Carbon Footprint: A Comparison of the Association between Household Characteristics and Emissions from Home Energy, Transport and Other Goods and Service. IZA, 2013


